Getting Started with AITable
Welcome to AITable!
AITable is an innovative management tool of digital data, based on the flexible multi-dimensional spreadsheet.
AITable origins from a pure idea: if there was a tool able to make software development and design 100 times easier, and enable everyone to become their own software designer, it would be great.
Unlike traditional spreadsheets or project collaboration tools, AITable is more like a flexible and easy-to-use database that can seamlessly connect any information and data together to build perfect custom workflows.
It is also a simple and intuitive data collaboration platform that can adapt to continuously changing requirements of teams, helping making adjustment of working progress, standardizing business processes, facilitating team collaboration, and enabling data tracking.
Five Components of AITable
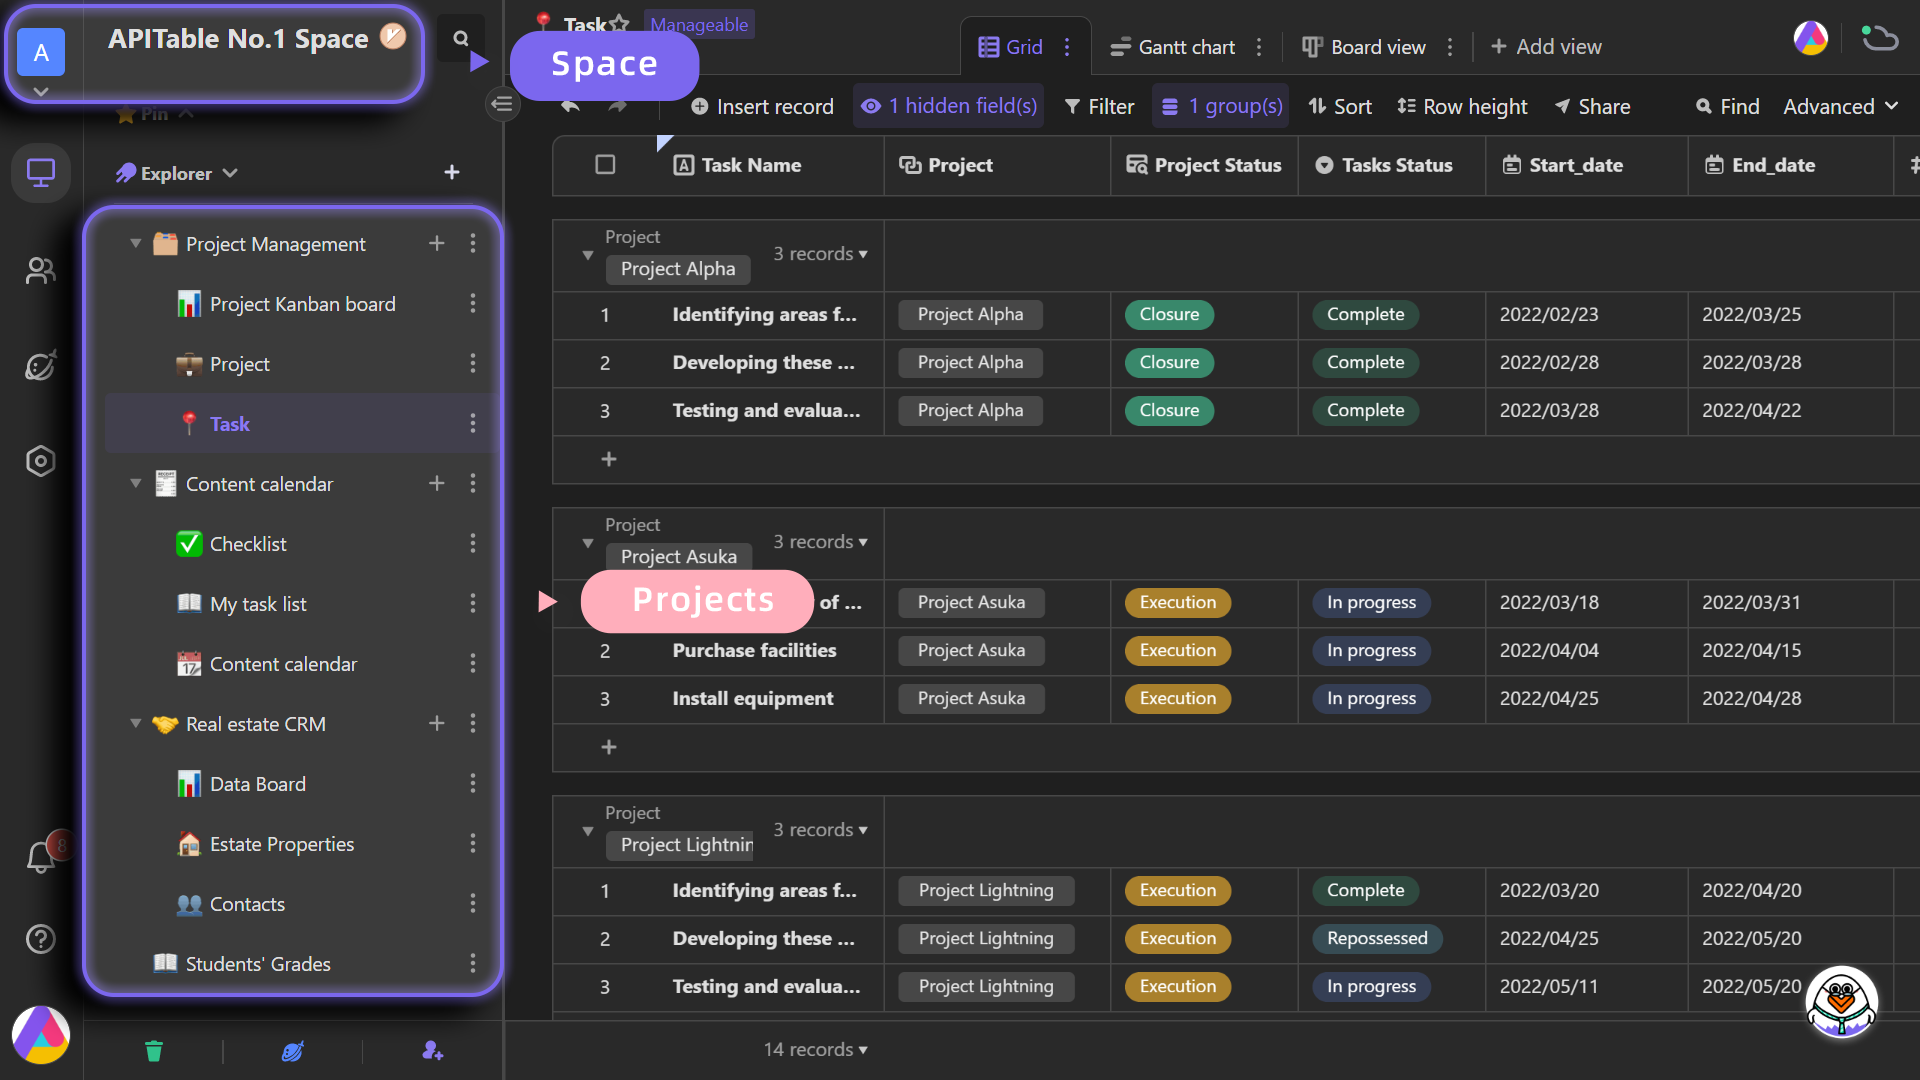
Space
A space is a collection of all collaborative projects.
It's like a virtual office, allowing team members to have a shared workspace to manage all their projects.
Datasheet
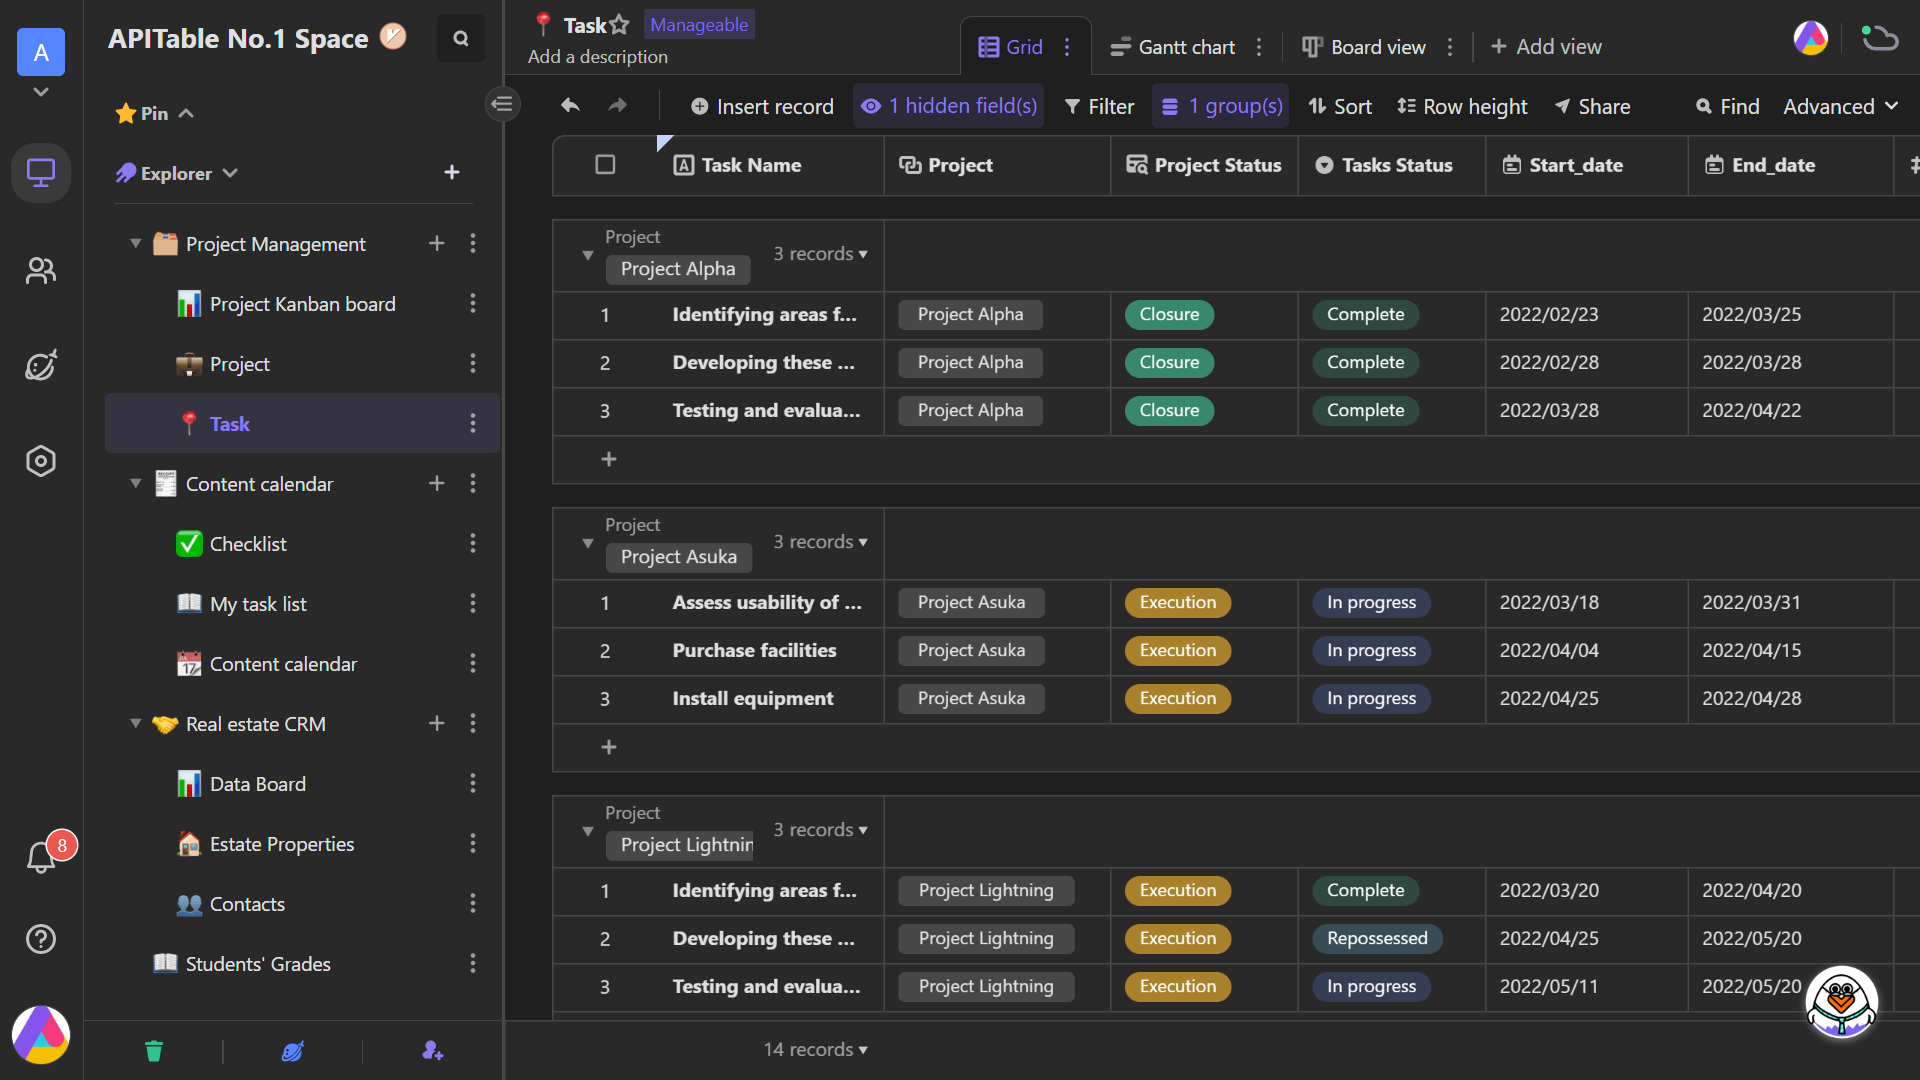
AITable is used to collect, store, and manage your business and project data.
With similarity of spreadsheet, it incorporates powerful and extensive features: rich dimensional column types, rainbow tag, attachments, table association, data linkage, operation history, open cloud and other multi-dimensional integration capabilities.
You can quickly build a "data engine" that meets the different needs of individuals and your enterprise, connecting everything based on data structures.
View
In addition to the standard view of grid, there are many other ways to display data.
With different views, you can process and manage data more efficiently and intuitively, and customize the forms of displaying data properly. Six types of view are available in AITable.
Grid view: A view is suitable for directly and intuitively adding, editing, displaying a large amount of information at the same time.

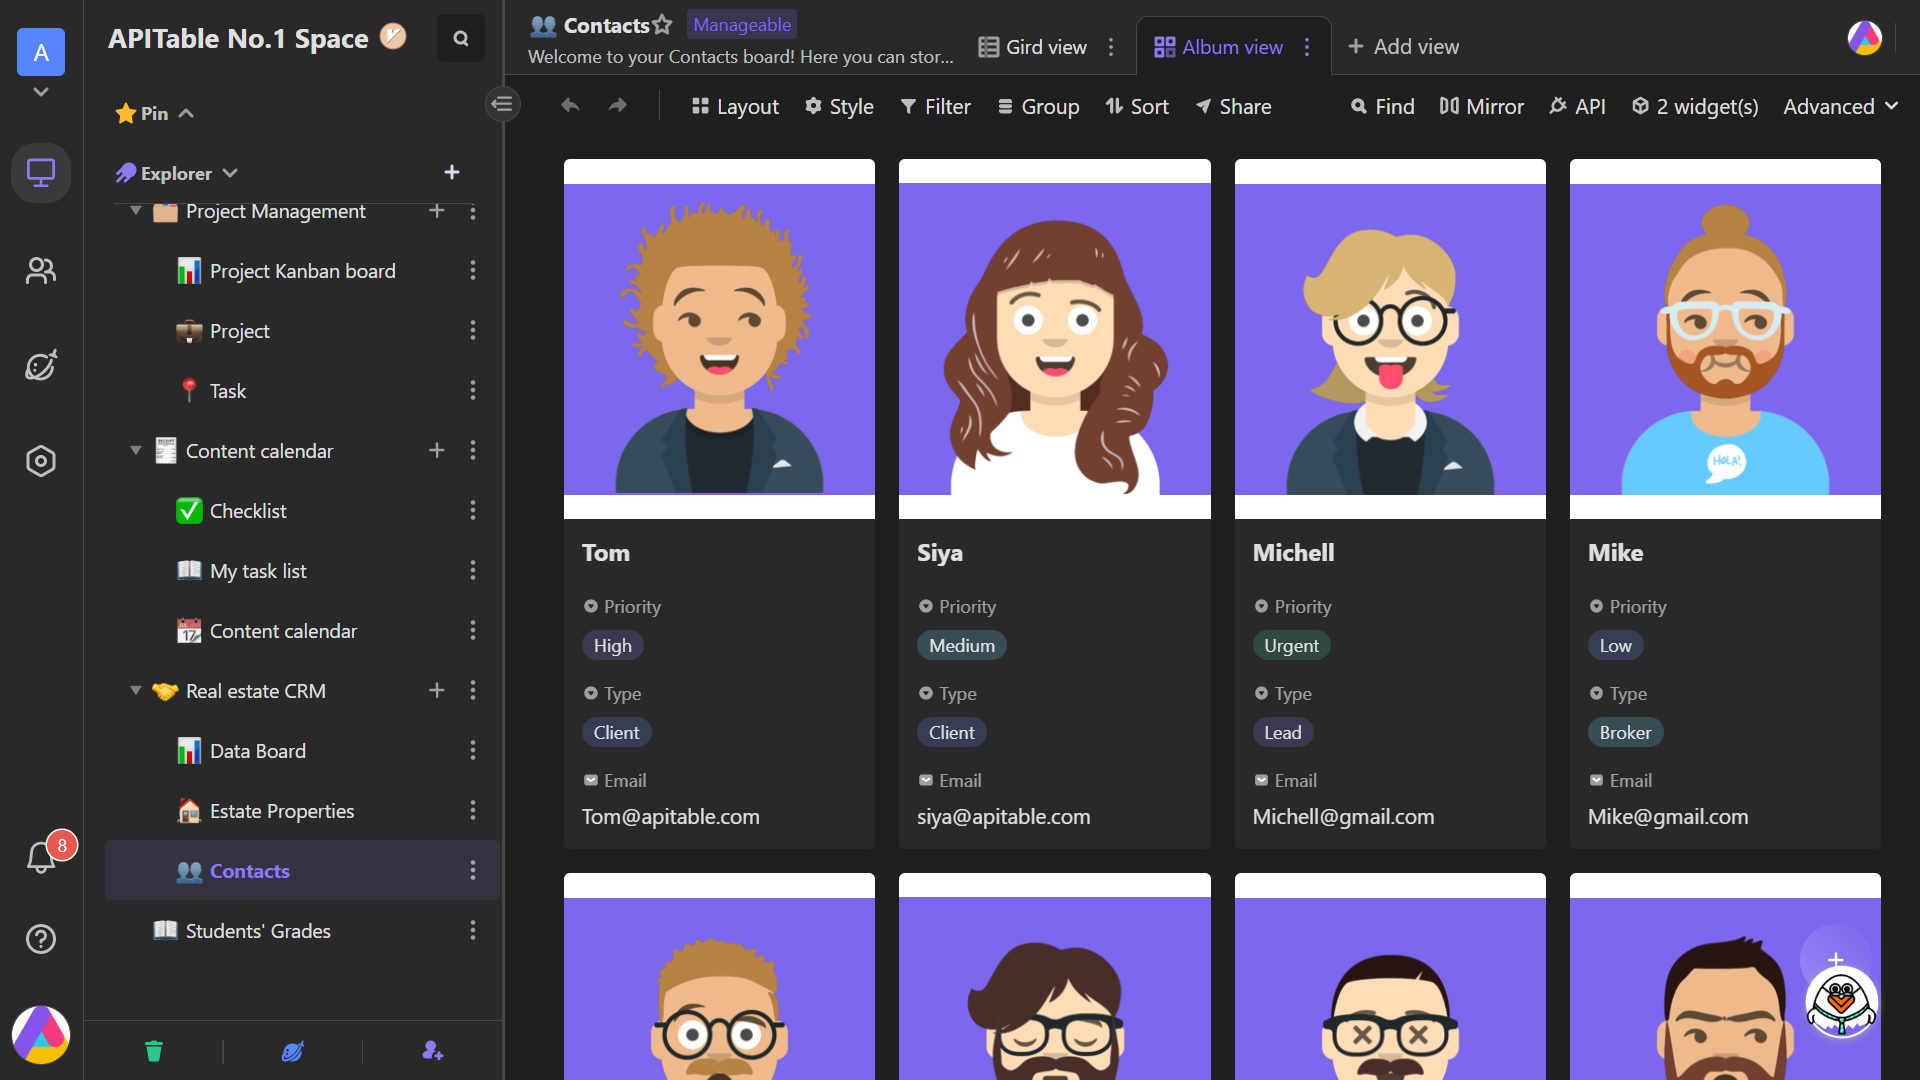
Album view: A view consists of small cards with highlighting the images of records.
Board view: A view is ideal for showcasing task progress, making project management and task assignment more easier.
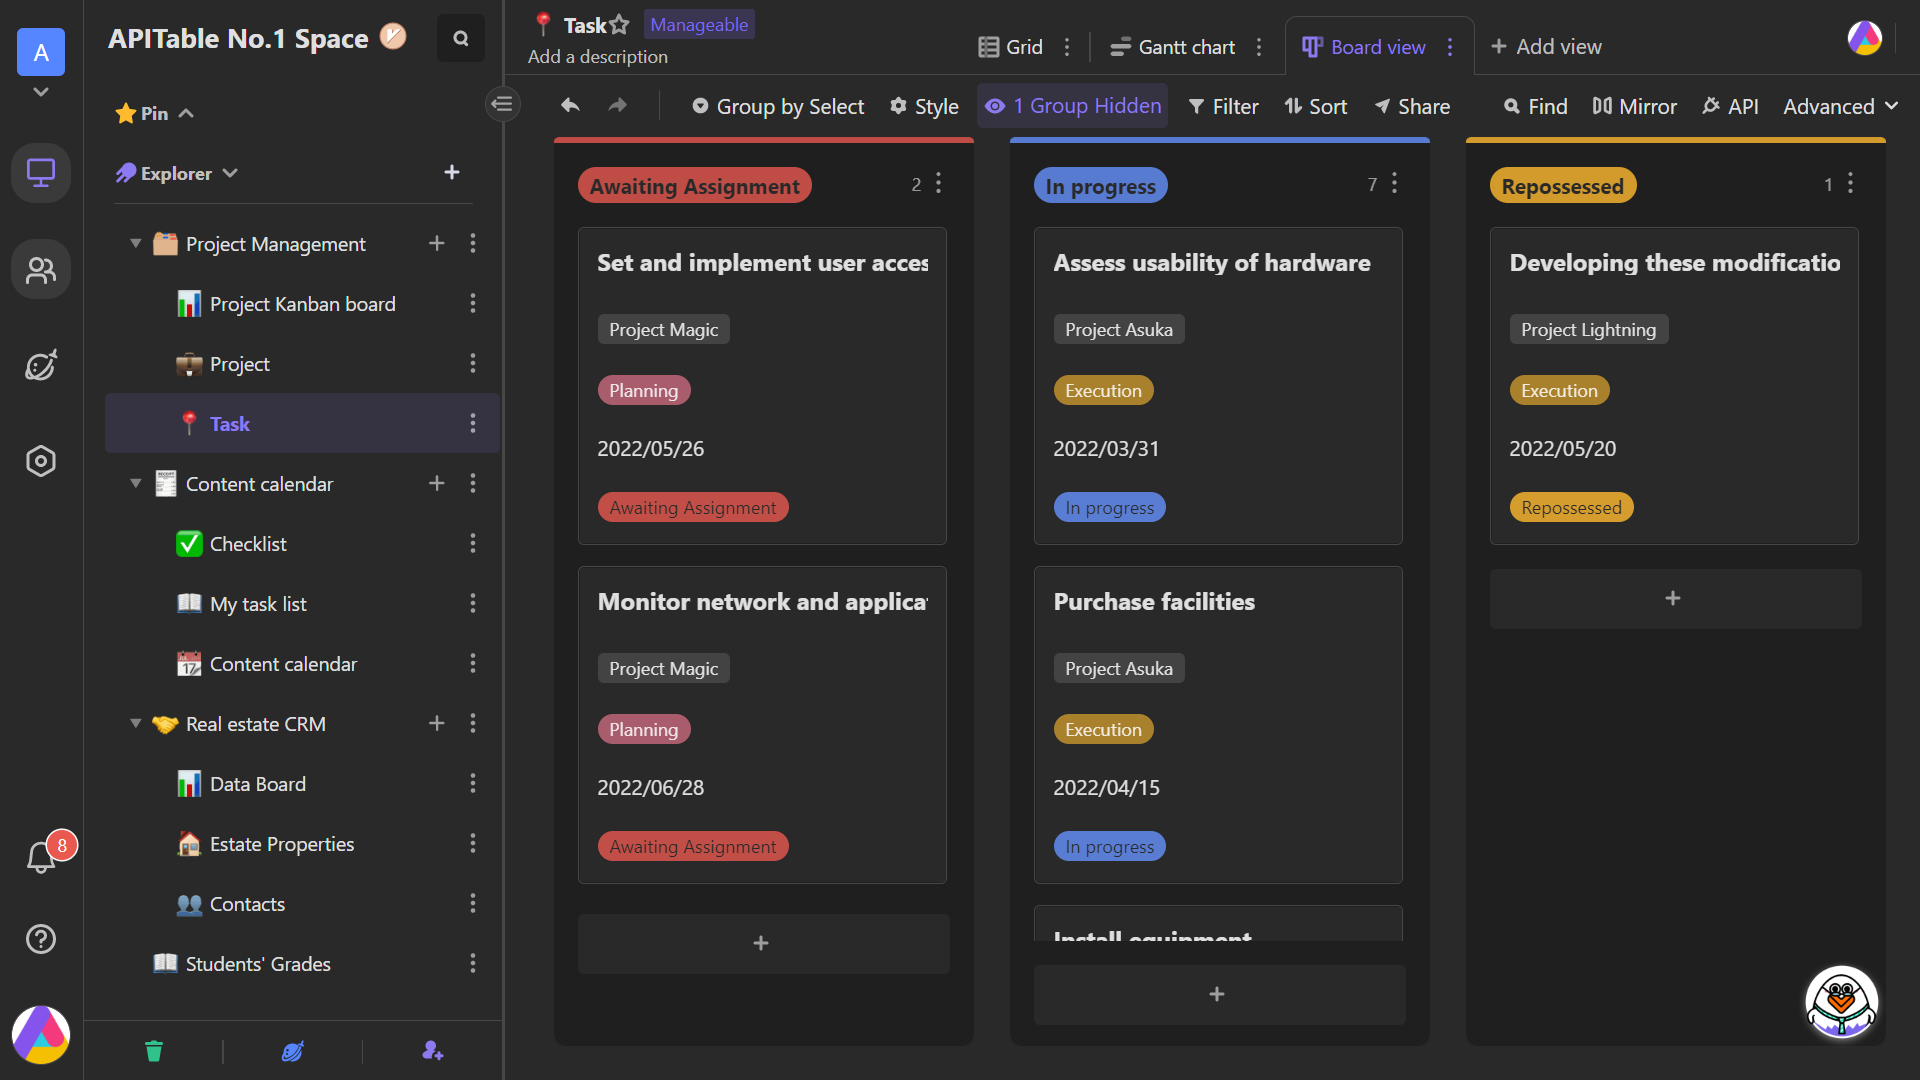
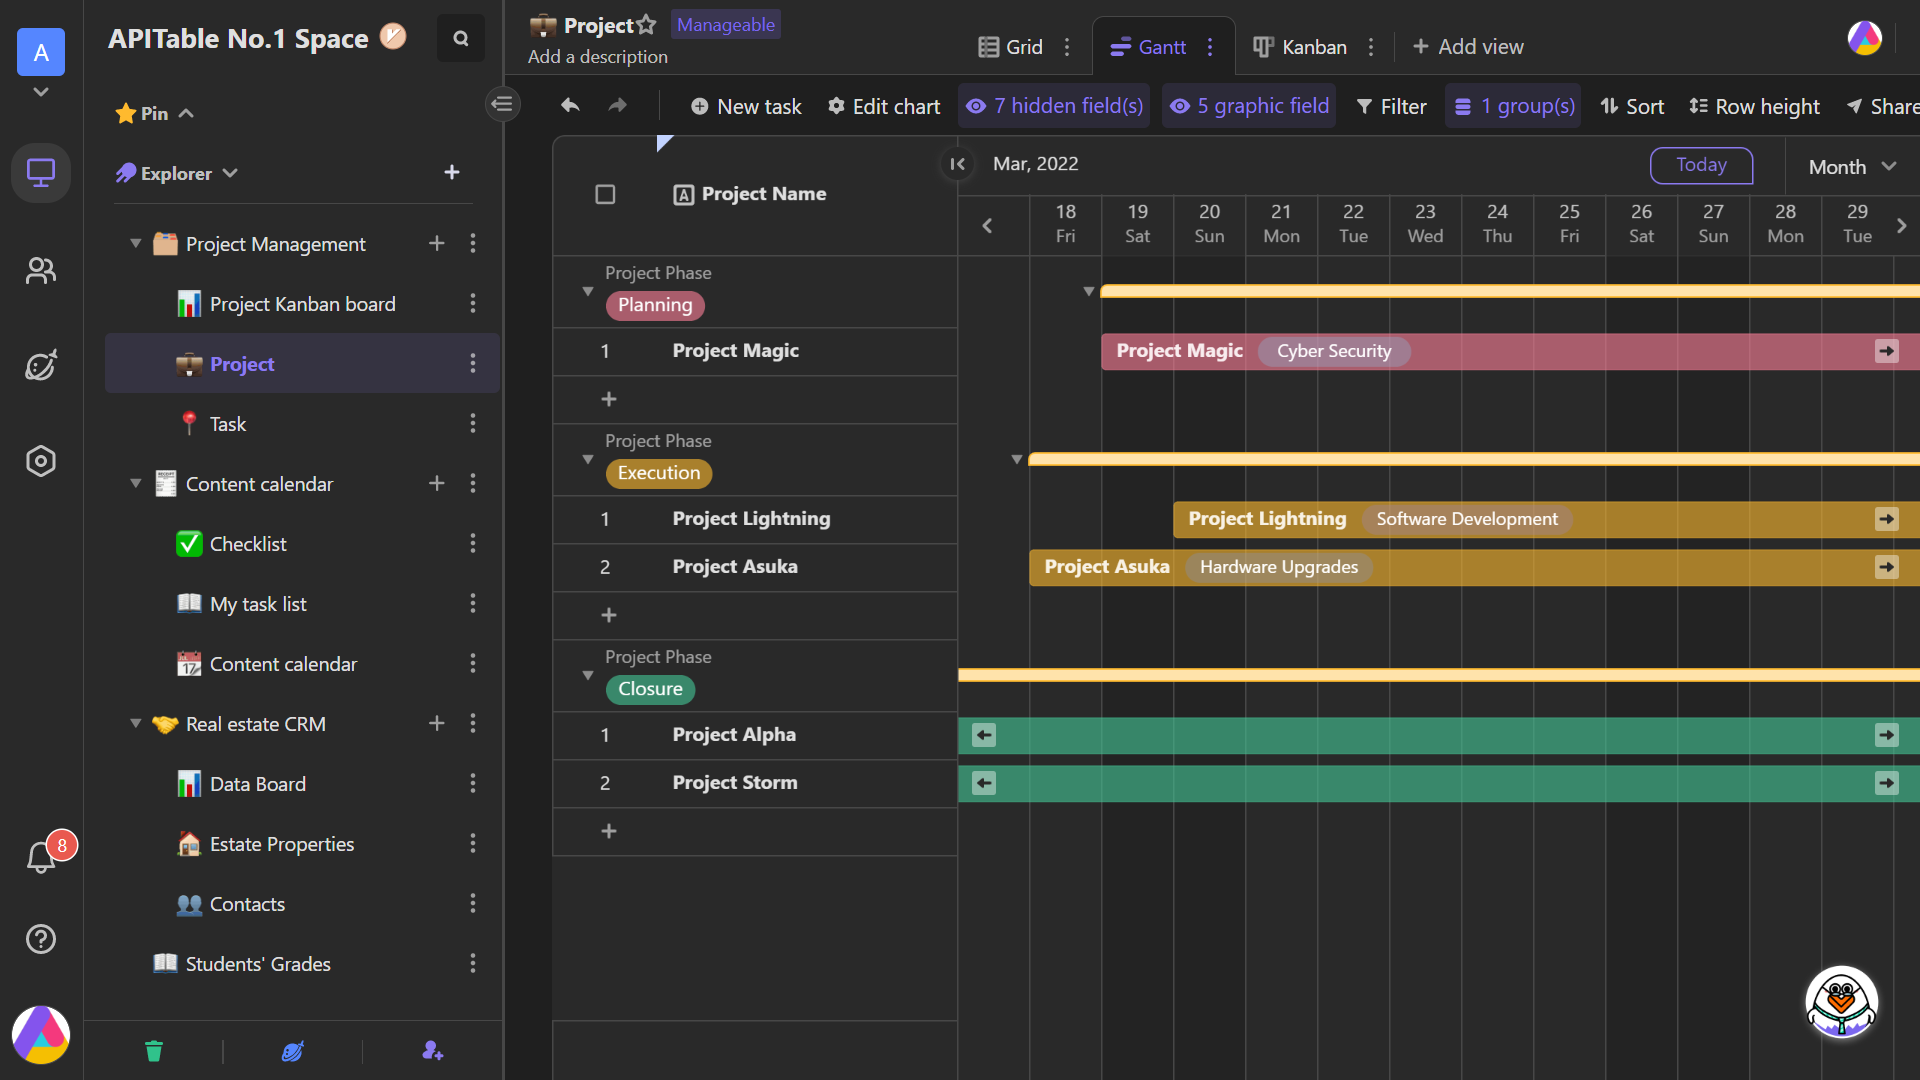
Gantt: A view of horizontal timeline showing the task sequence and duration and helping manage overall projects.
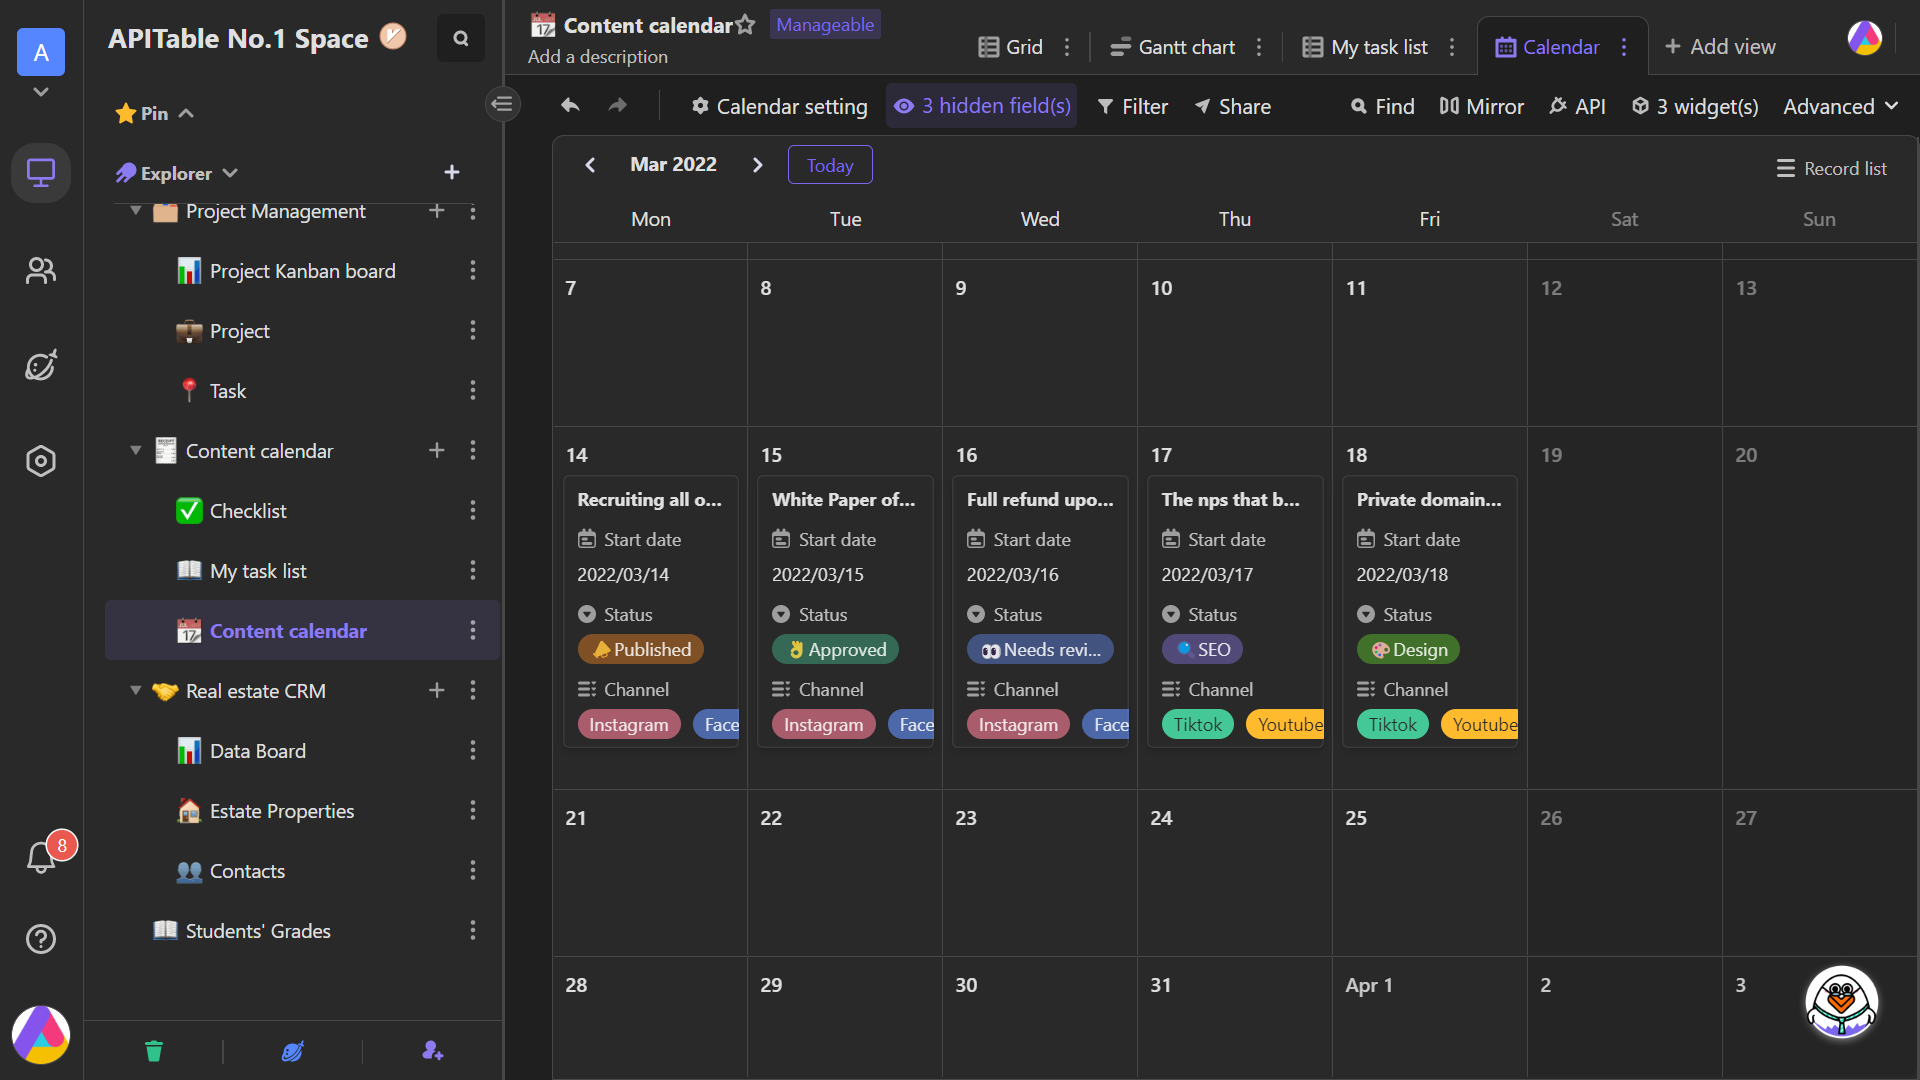
Calendar: A clear view of all schedules in a month, providing teams and individuals with a visual calendar planner.
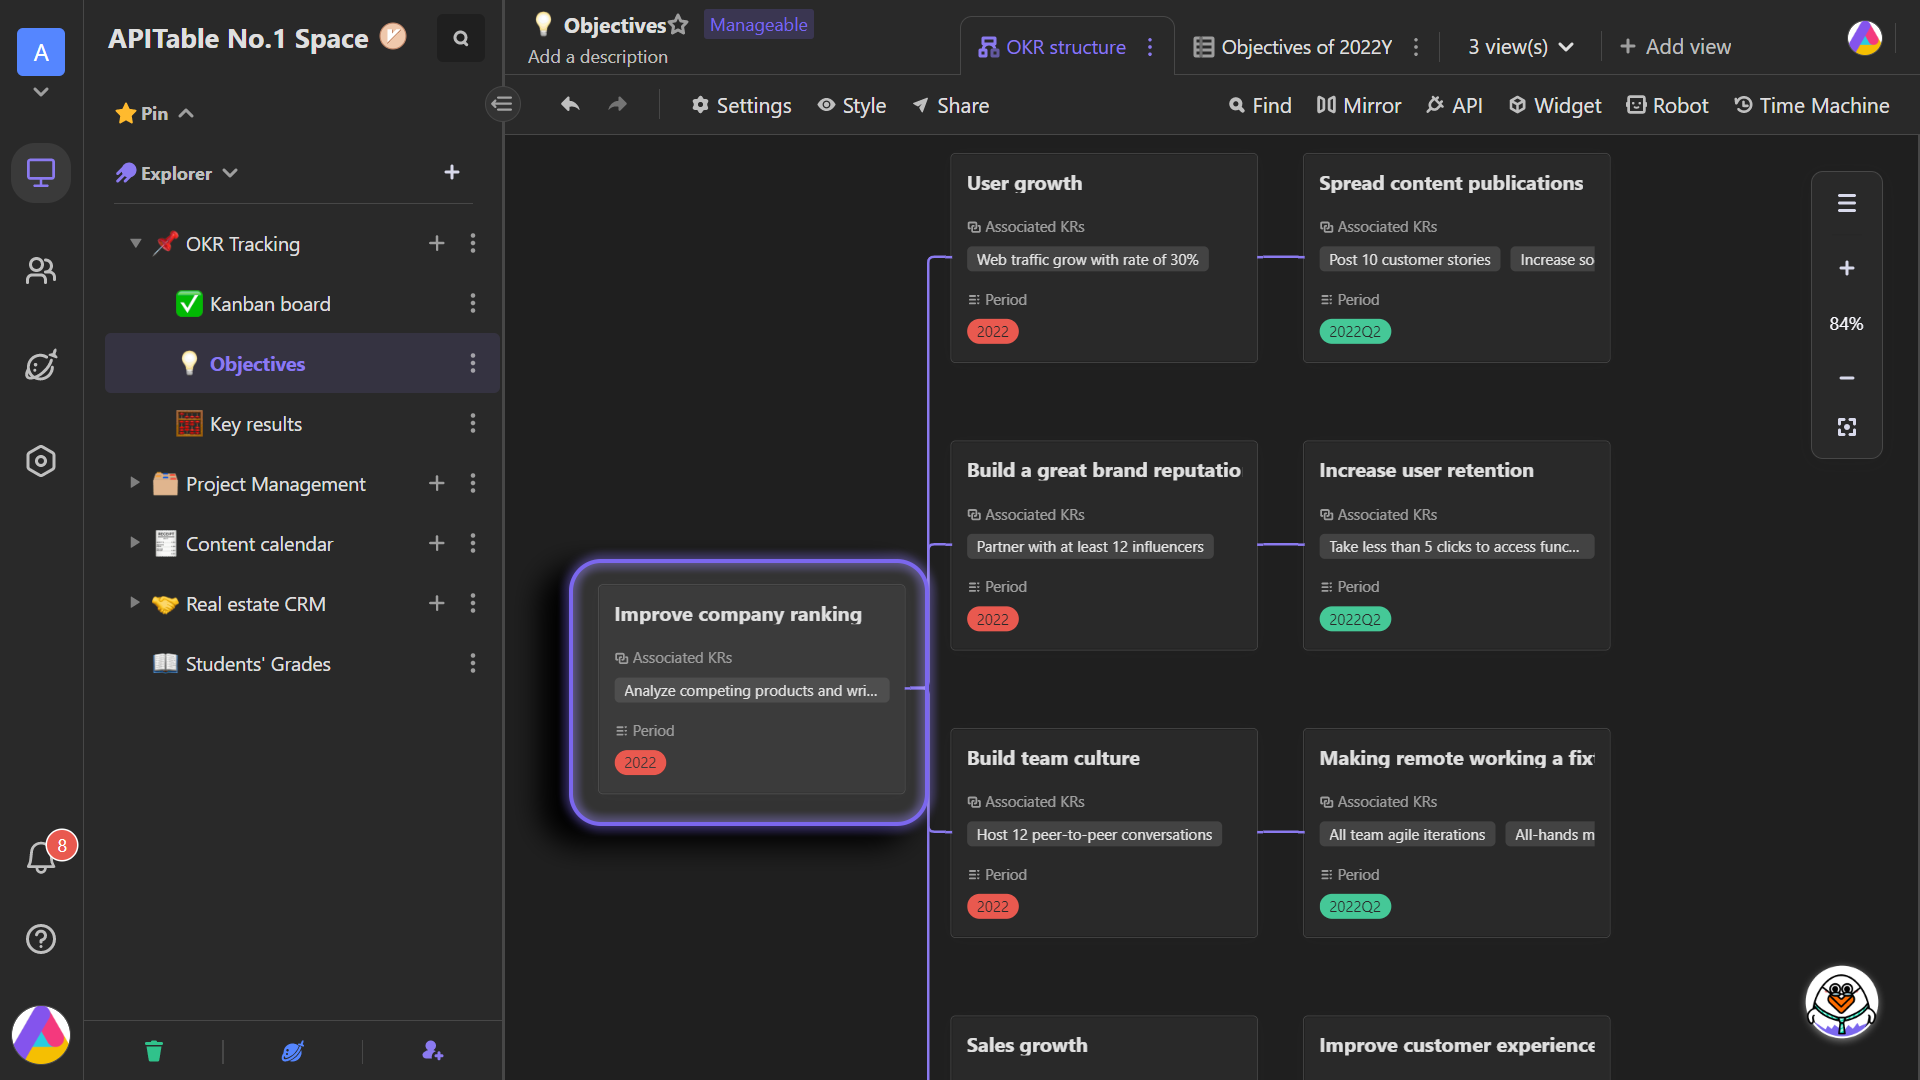
Architecture view: A view showing the hierarchy information. By dragging the cards, you can structure the information and build a delicate description of a enterprise organization.
Dashboard and widgets
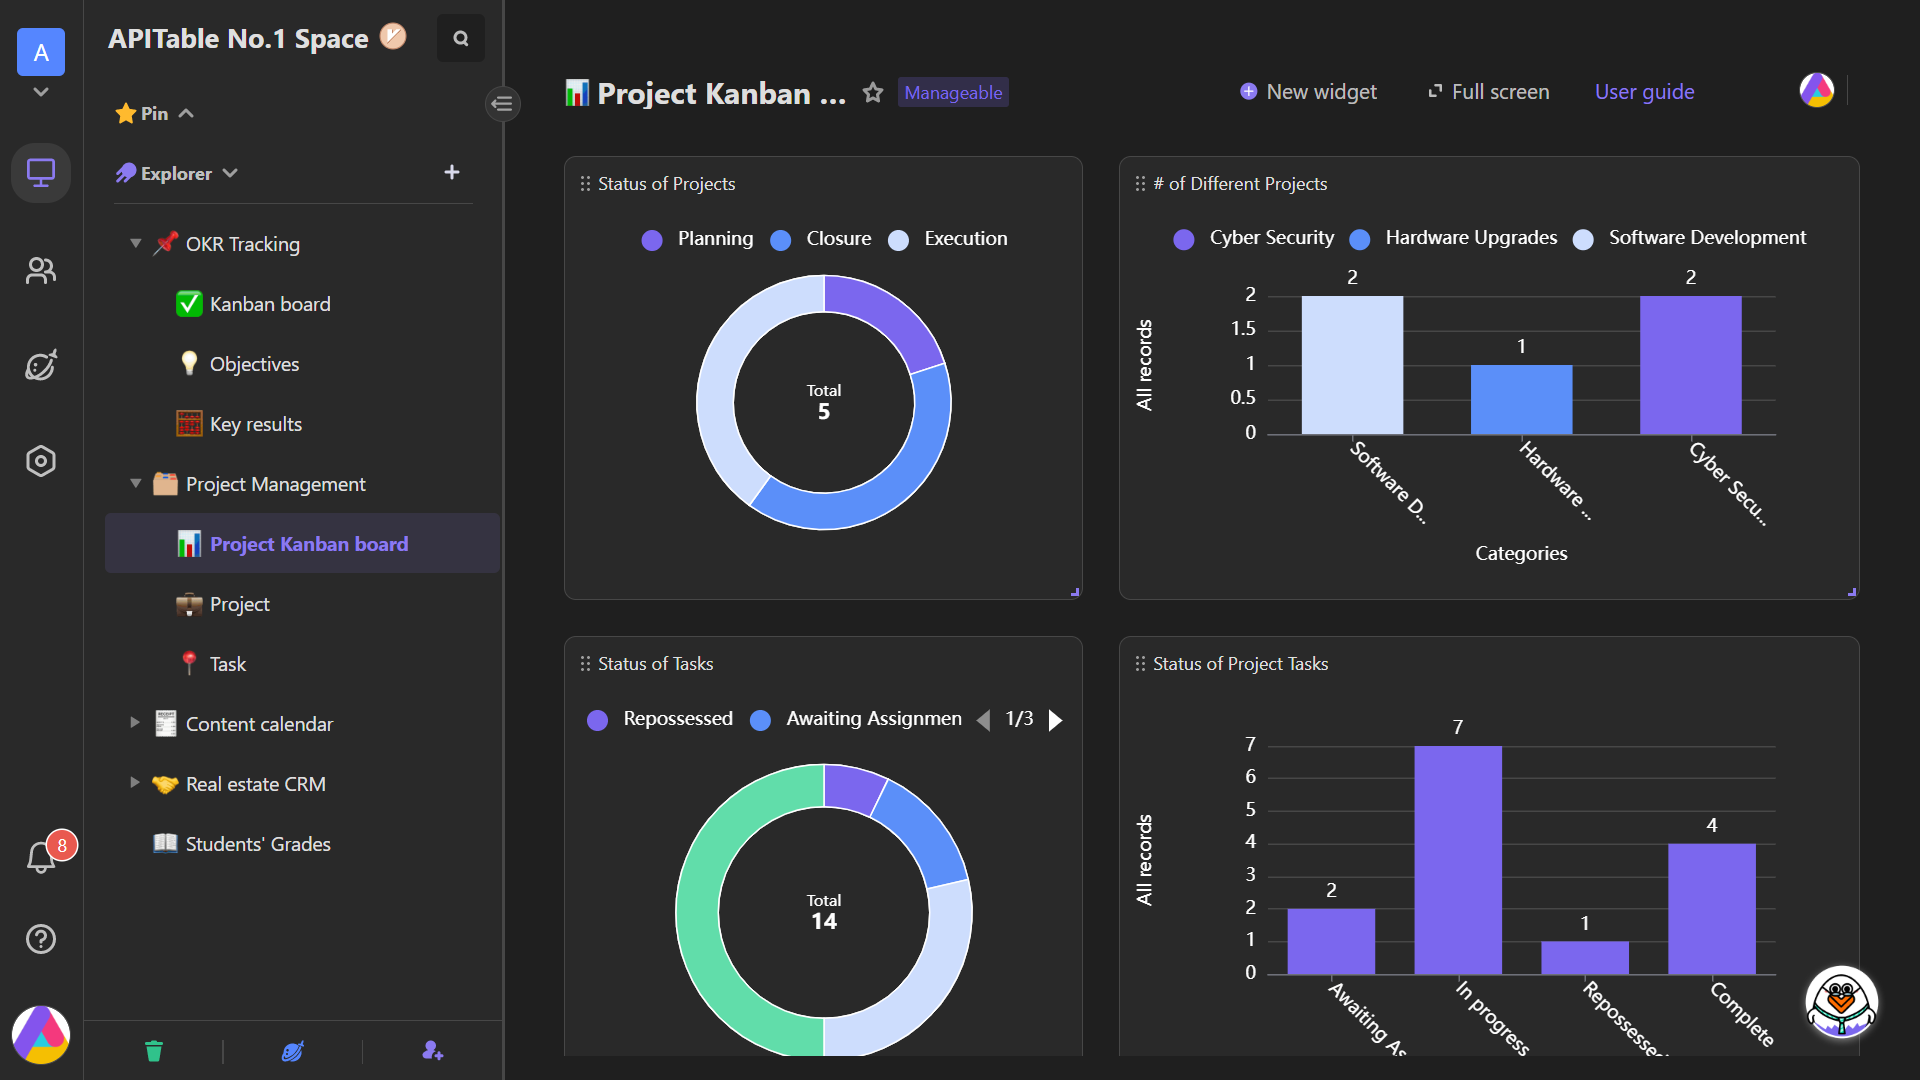
A dashboard is a new file type that acts like a container, allowing data to be extended with more capabilities by using various widgets.
No code, simply drag and drop, your data can be visualized.
Users' roles and permissions
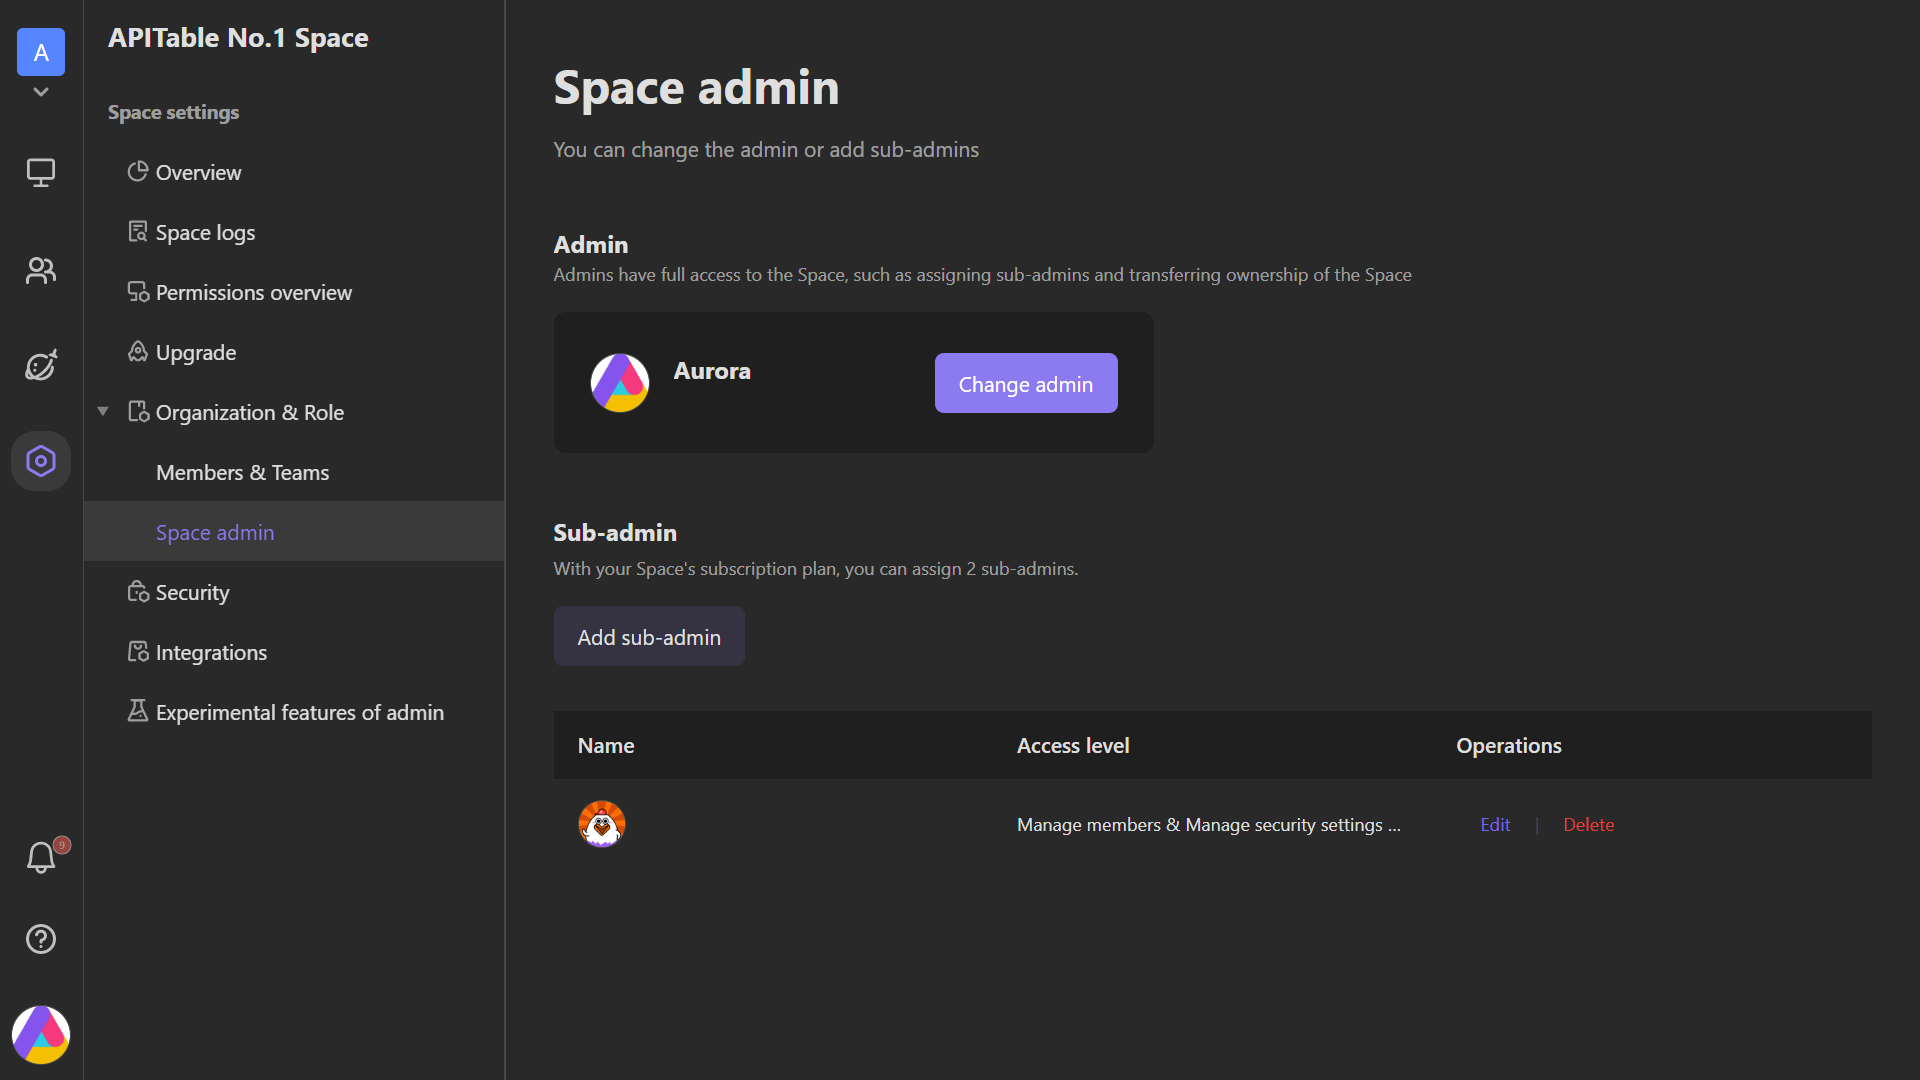
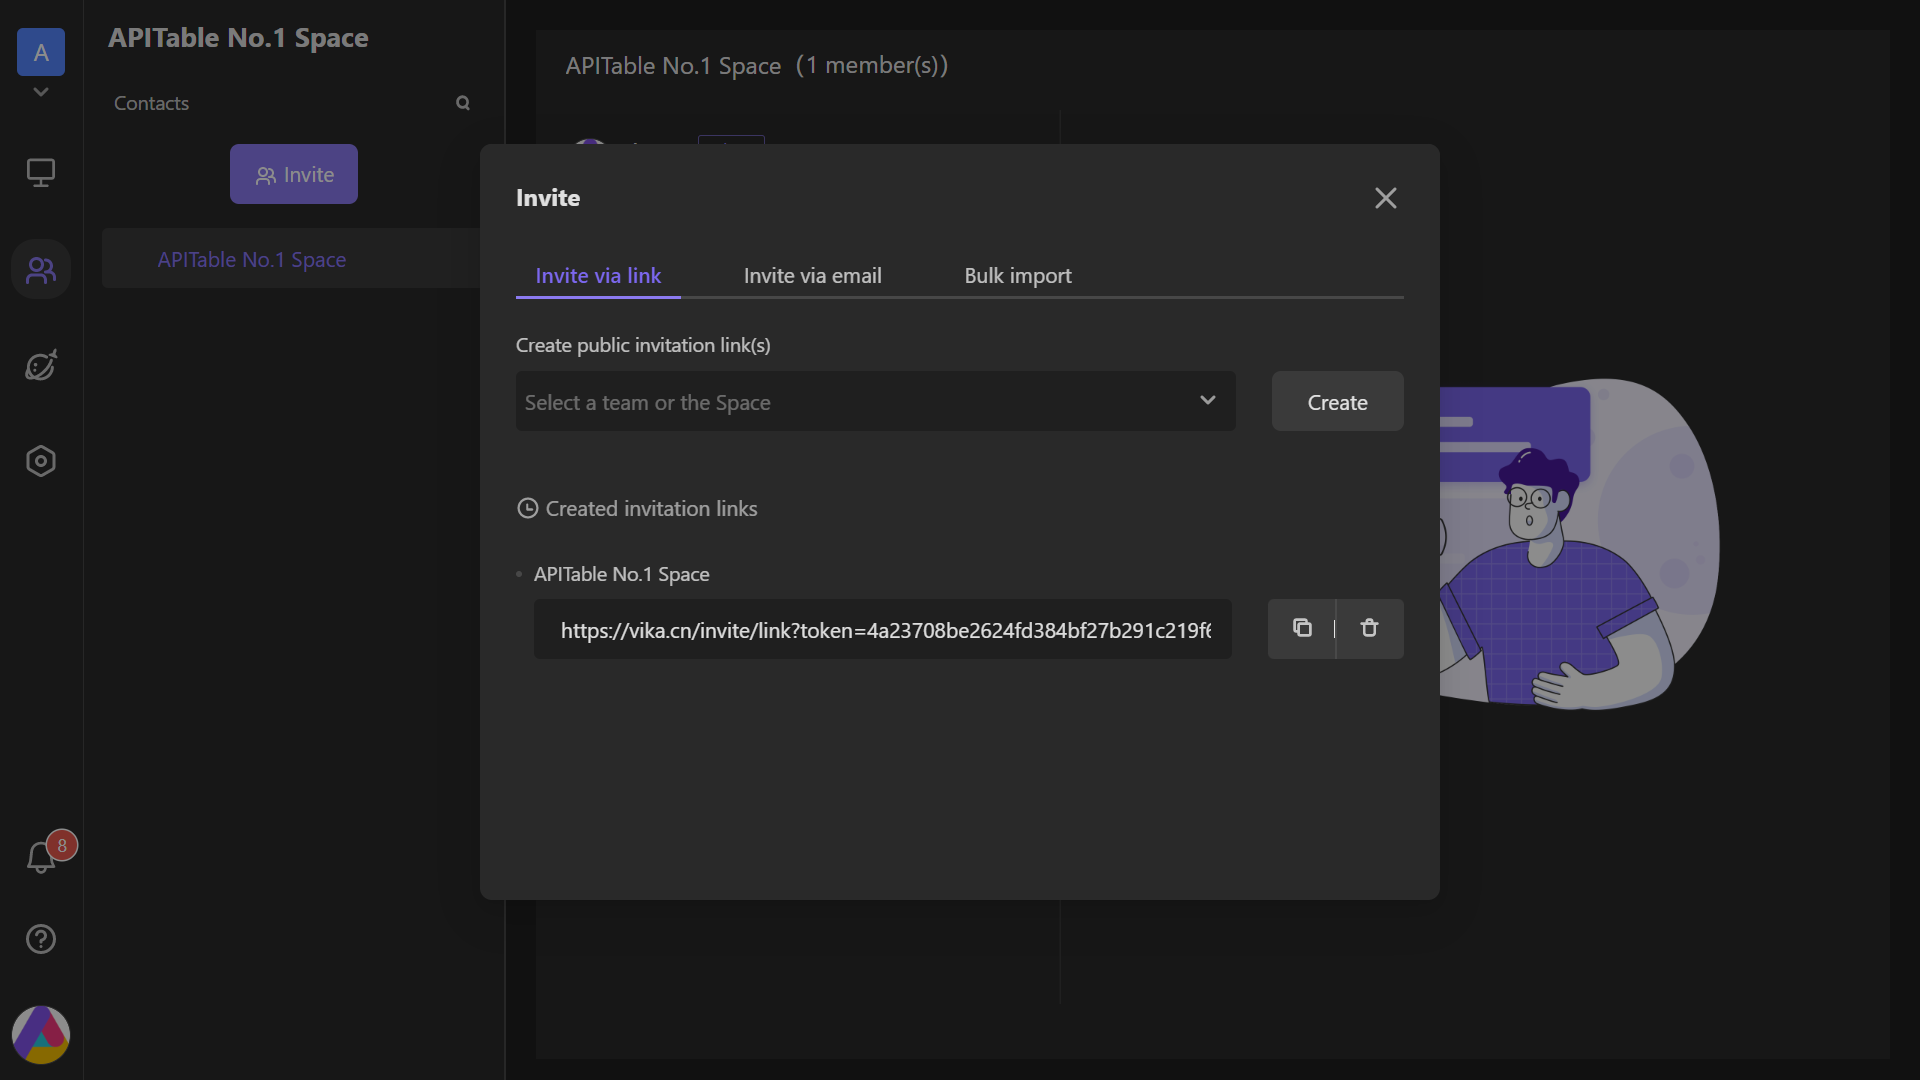
After creating a space, you are the master administrator of the space and have unrestricted permissions in the space.You can friends or team members to work together in your space, and assign them as sub-administrators to give certain specific permissions.
Invite collaborators
Assign sub-administrator
